

A vllm serve process can look like one command from the terminal while expanding into an API server, engine core, GPU workers, and—under data parallelism—a coordinator process. Startup failures become easier to locate once those process boundaries and their initialization order are clear. This article follows vLLM's V1 architecture from CLI invocation through request scheduling and the device forward pass.
The chain starts in a file most of us never open: pyproject.toml. The vllm command maps to a single entry point, vllm.entrypoints.cli.main:main, and every process you later see in ps aux descends from that one function. The call sequence is short enough to memorize:
main() parses your arguments with a subparser and recognizes the serve subcommand.ServeSubcommand.cmd(), which calls run_server() through uvloop.run() — so the whole HTTP server runs on a uvloop event loop, not plain asyncio.run_server() then opens async with build_async_engine_client(args), the line where the engine actually comes to life.This is also the decision point between the old V0 engine and the V1 engine, chosen based on your configuration.
Before any process spawns, your CLI flags get resolved. AsyncEngineArgs.from_cli_args(args) converts them into engine arguments, and create_engine_config() folds everything into a single VllmConfig. When a startup fails, this is where I look first: the V1 design threads one config object through the entire class hierarchy, so a bad value here reproduces identically in every process downstream.
On the V1 path (VLLM_USE_V1 enabled), AsyncLLM.from_vllm_config() builds the async frontend. The frontend does not run the model itself. Instead, it creates an AsyncMPClient — or a DPAsyncMPClient when data parallelism is on — and that client spawns EngineCoreProc as a separate background process. The split is deliberate, done for both isolation and performance, and every message between the two sides travels over ZMQ IPC sockets. That is the first process boundary you'll catch in a process listing.
LLM object directly and call it — no server, no HTTP./v1/chat/completions, /v1/completions, and /v1/embeddings.EngineCoreRequests.InprocClient for synchronous single-process setups, DPLBAsyncMPClient for distributed serving.EngineCoreOutputs into the RequestOutput you actually consume.That thinness is new. Historically, LLMEngine was the core component handling input processing, scheduling, model execution (including distributed execution), and output processing, while AsyncLLMEngine wrapped it in an asyncio background loop for online serving — the class the OpenAI-compatible API server was built on. V1 breaks that monolith apart. The heavy part of the old engine now lives inside EngineCoreProc, and that's exactly where the next section goes.
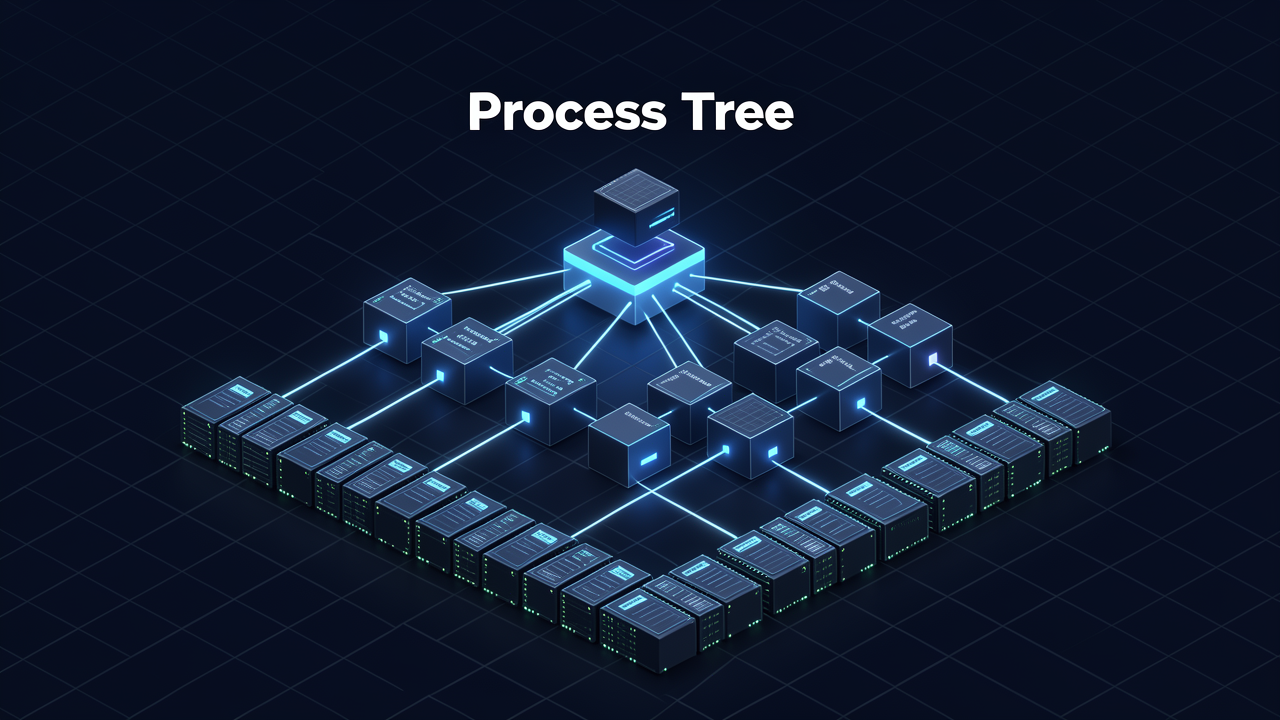
Those mysterious names in ps aux finally make sense once you see that vLLM V1 deliberately splits its work across distinct process types, each with one narrow job. I've come to read the tree as four roles: an API Server, one or more Engine Cores, a GPU Worker per accelerator, and — only under data parallelism — a single DP Coordinator. Here's what each one actually does.
This is the process your requests hit first. It handles HTTP traffic for the OpenAI-compatible API, but it also does real work before anything reaches the GPU: tokenization and multi-modal data loading, and afterwards it streams results back to clients. By default there is 1 API server, but the count scales automatically to match the data-parallel size, and you can override it manually with --api-server-count. Two details I find worth remembering when debugging:
VLLM_MEDIA_LOADING_THREAD_COUNT CPU threads, default 8 — worth checking when image-heavy traffic saturates the frontend instead of the GPU.Each engine core runs the scheduler that decides which requests get processed in each step, manages the KV cache, and coordinates model execution across the GPU workers. It lives in a busy loop: continuously schedule, dispatch, repeat. There is exactly 1 engine core per data-parallel rank, so --data-parallel-size 4 gives you 4 of them.
The GPU Worker sits at the bottom of the tree: one process per accelerator device, executing the model's forward passes. The DP Coordinator only appears when --data-parallel-size > 1 — exactly one instance — with two jobs: load balancing across DP ranks, and coordinating synchronized forward passes for MoE (Mixture of Experts) models.
Once I learned the arithmetic, hung startups stopped looking random. With N GPUs, tensor-parallel size TP, pipeline-parallel size PP, data-parallel size DP, and A API servers, the total comes to A + DP + N processes, plus 1 more if DP > 1, where the worker count is N = DP × PP × TP. Two worked examples:
vllm serve -tp=4 → 1 API server + 1 engine core + 4 GPU workers = 6 processes.vllm serve -tp=2 -dp=4 → 4 API servers (auto-scaled to DP size) + 4 engine cores + 8 GPU workers + 1 DP coordinator = 17 processes.Run ps aux against that second command and you can count your way to certainty: 17 entries means everything spawned correctly; 15 means something died mid-launch.
The split isn't architecture for its own sake. Previously, the API server and the LLM engine ran in the same Python process and competed for CPU cycles, because Python's Global Interpreter Lock (GIL) prevents true multithreading — tokenizing one request could stall a scheduling step in the same interpreter. Separating them removes that GIL contention. And running EngineCoreProc as a separate background process has a second payoff: engine failures stay isolated from the HTTP frontend, so a crash inside the engine doesn't take the API server down with it.

Before the engine core can touch a GPU, it has to answer one question: who actually runs the model? That's the executor's job — and here's the part that tripped me up at first: you almost never pick one by hand. The choice happens automatically inside Executor.get_class() and ParallelConfig.post_init(), which quietly map your hardware setup to one of four backends:
The decision logic reads like a short checklist:
On a plain single-GPU box, the answer is 'uni', and all computation stays in one process with zero inter-process communication overhead. The initialization flow still follows the same ritual as every other backend:
What I find clever here is that even with no second process to talk to, the wrapper still uses the same RPC-style calls as multi-process setups. The code path is identical whether you run one GPU or eight.
The 'mp' path kicks in when the weights no longer fit on a single GPU and the model gets sharded with tensor parallelism — think TP=8. Pipeline parallelism across nodes is the next escalation, and by then you're firmly in Ray territory.
This constructor is exactly where the extra branches of my ps aux process tree come from:
At runtime, the executor's job is almost anticlimactic: it just enqueues requests into rpc_broadcast_mq, and every rank picks them up.
That's the practical debugging payoff of this section. Once you know which executor your config selects, you know exactly how many processes should exist, what each one is responsible for, and which stage to watch when startup hangs.
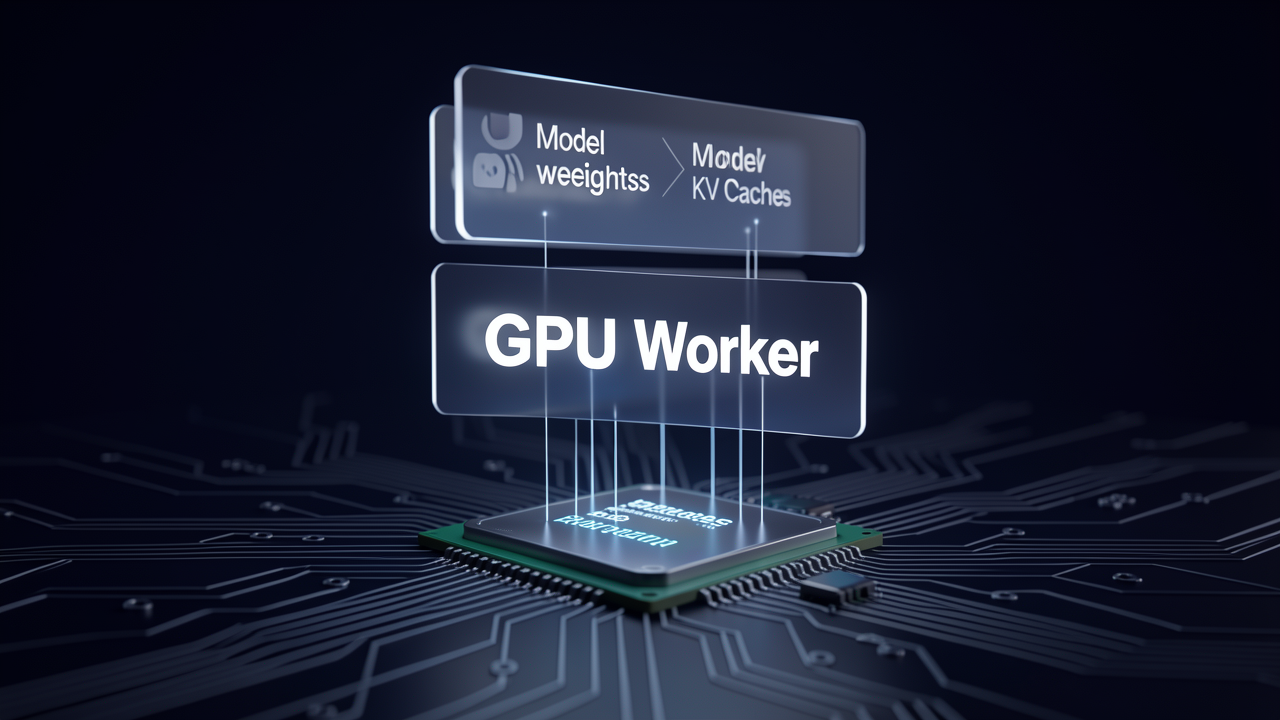
Following the process tree all the way down, we finally reach its leaves: the worker processes. And the first detail that stands out when I trace their startup path is that a fresh worker is almost completely empty. Before any GPU work happens, vLLM wraps every process in WorkerWrapperBase, which represents one process in the executor. This wrapper deliberately delays the heavy lifting, and the exact order of that delay matters when you're staring at a hung startup.
The wrapper comes alive in three ordered steps:
Two constructor parameters carry all the weight here:
The arithmetic is refreshingly simple: TP=2 with PP=2 gives 4 workers total, each eventually pinned to its own device.
Once the wrapper resolves the real class, a three-layer hierarchy forms:
This layering is worth memorizing, because a hang maps cleanly onto it: a failure in device setup points at the Worker, while a failure in tensor preparation points at the Model Runner.
On CUDA, Worker.init_device() runs a fixed sequence where every line has a documented reason:
The model executor construction then runs three procedures in order:
Once all three finish, the process that started as an empty wrapper is a fully armed worker: device claimed, weights sharded into place, KV cache sized against real free memory. So the next time a startup hangs and ps aux shows a worker just sitting there, the question is no longer "is it broken?" — it's "which stage is it in?" A worker stuck before init_worker has a class-resolution problem; one stuck after Load Model is busy sizing its cache. The lifecycle turns a hang into a location on the map, and from here, the only thing left to trace is what happens when the first real request arrives.
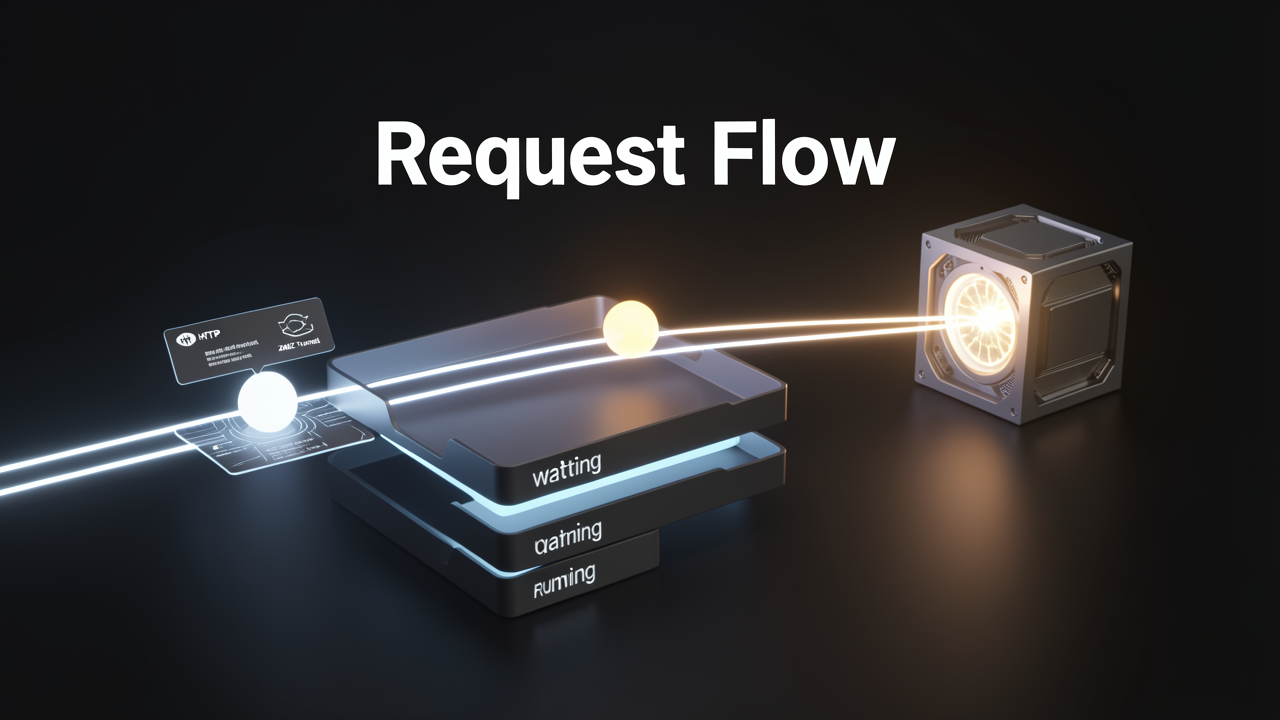
With the process tree mapped out, the next thing I wanted to understand was how a request actually flows through that tree — because once you can name every hop, a hung request stops being mysterious and starts being locatable.
The journey starts in the API server process. An HTTP POST hits OpenAIServingCompletion's create_completion route, and from that moment the raw text prompt gets prepared for engine consumption. Two things happen here:
With the package built, the frontend calls AsyncLLM.generate. In a data-parallel setup, that call lands on DPAsyncMPClient.add_request_async, which invokes get_core_engine_for_request — the load-balancing decision point. This function reads the DP coordinator's state to pick which engine core should own the request, and the ADD request is sent down the chosen engine's input_socket.
What surprised me here is how little the frontend knows. It doesn't poll GPUs or track queue depths locally; it trusts the coordinator's view. That's why, when I was debugging, watching the DP coordinator's state was far more informative than watching the API server.
On the engine core side, the message arriving on the input_socket wakes up a small pipeline of threads — and this is where the multi-process design starts to feel intentional rather than accidental:
input_queue.engine_core.step(), pushing intermediate results onto the output_queue until a stop condition is met.So when a request appears stuck, one of these three queues is almost always the culprit. Knowing the division of labor tells you exactly which one to inspect.
Inside the engine, each request gets wrapped in a Request object, its status is set to WAITING, and it's added to the scheduler's waiting queue. The queueing policy matters here: requests are appended under an FCFS policy, or heap-pushed under a priority policy. That's a detail I initially overlooked, but it explains why request ordering can look odd if you assumed strict FIFO everywhere.
The engine then loops over step() as long as requests remain, and every step runs three stages:
During scheduling, the engine prioritizes decode requests already in the running queue — computing how many new tokens to generate, calling allocate_slots, and updating the token budget. Only then does it process prefill requests from the waiting queue, retrieving computed blocks, allocating slots, and moving them to running.
This ordering was a genuine "aha" for me: decodes get first claim on the token budget, and prefills get whatever's left. A burst of prefills doesn't starve the decodes that are mid-generation — the budget math protects them.
Understanding the split between the two workloads explains most of vLLM's performance character:
And here is the V1 design decision that everything else rests on: V0 could process either prefill or decode in a step, but the V1 scheduler mixes both in the same step. That interleaving is the foundation of its continuous batching — no more alternating phases, no more bubbles between them.
The final piece of the scheduler's toolkit is what happens under memory pressure. Rather than failing, the engine can attempt recompute preemption: it evicts low-priority requests and returns their KV blocks to the block pool. The request isn't dropped — it can be rescheduled later, recomputing its prefill from scratch since its KV cache is gone.
That's the full route: one POST, three threads, a three-stage loop, and a scheduler juggling two very different workloads — all coordinated by that single VllmConfig threading through every layer. And when the queues back up instead, you now know exactly where to look.
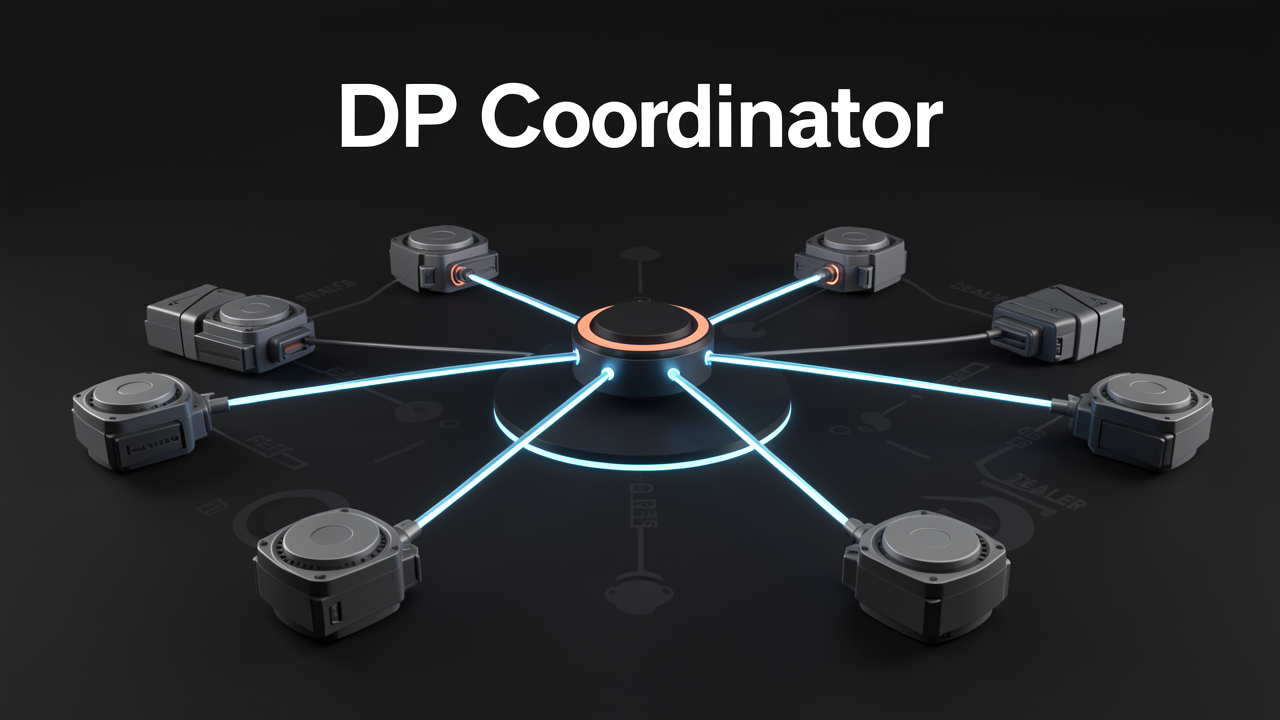
Not every vllm serve invocation spawns the same process tree, and data parallelism is the reason why. The DP Coordinator process only exists when you launch with --data-parallel-size > 1 — and there is always exactly one instance, never one per rank. When I compared process trees across deployments, this explained a lot: two servers running the same model looked completely different in ps aux simply because one had DP turned on. The coordinator carries two distinct jobs: it load balances incoming requests across the DP ranks, and it coordinates synchronized forward passes for MoE (Mixture of Experts) models, where replicas must move together. With a single DP rank, vLLM skips the process entirely — no coordinator, no extra moving part to break.
Behind the coordinator, the engine side gets busier:
Inside each engine core, three threads split the work:
The synchronization detail I find most clever is dummy steps for lockstep. Whenever any DP replica has real work, every replica executes a forward step — idle ones simply run an empty one. That keeps all replicas aligned step-for-step, which is exactly what MoE expert parallelism needs: replica state never drifts apart. The price of idling is some wasted compute; the payoff is that no replica ever falls behind mid-generation.
The frontend changes shape too. An AsyncLLM object — the asyncio wrapper around the engine — now creates a DPLBAsyncMPClient, the client built to talk to multiple engine cores at once. Sitting between frontend and backend is the DPCoordinator process, mediating in both directions: it pushes load-balancing info toward the frontend and handles scaling commands coming back. On top of that, separate asyncio tasks run concurrently for input requests, output messages, and coordinator communication, while a FastAPI app keeps exposing the same HTTP API — the outside world never sees any of this machinery.
When a DP deployment hangs, I work through three suspects in order:
Those are the three moving parts this whole synchronization scheme depends on. If all three check out, your problem is elsewhere; if one of them fails, you've found your hang — and this time, you found it by reading the process tree instead of restarting and hoping.
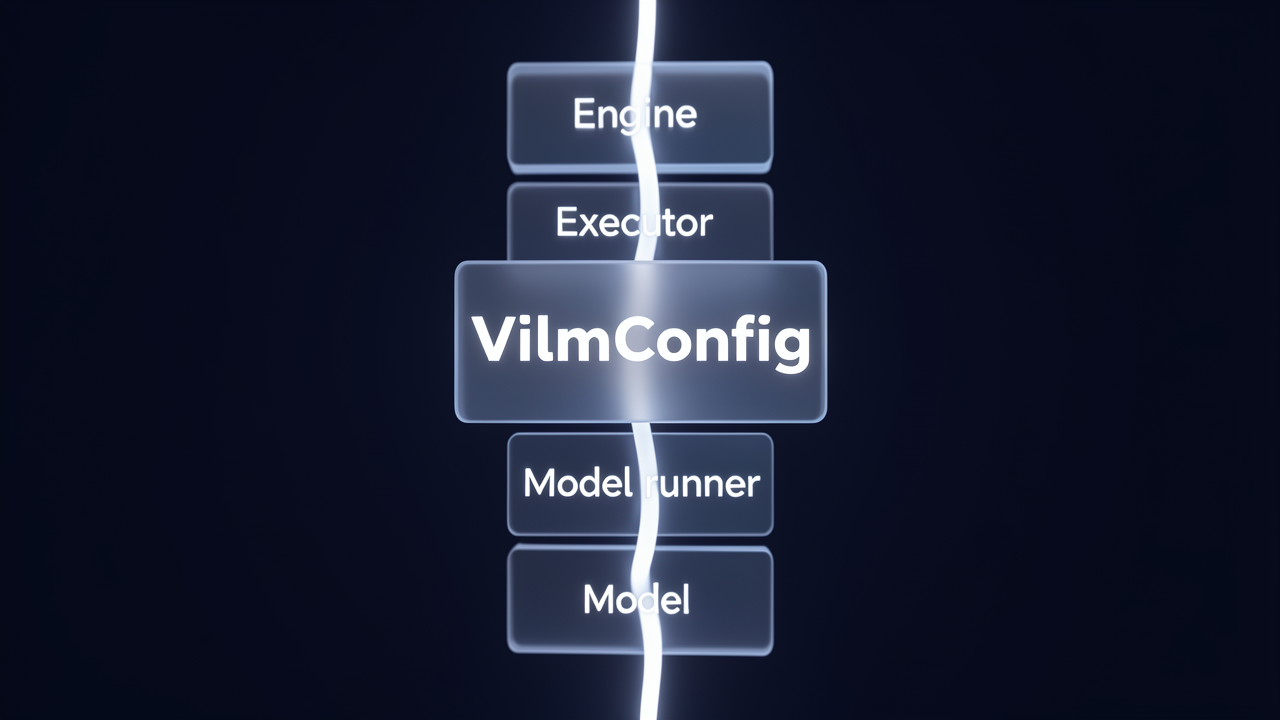
After following a request from the CLI all the way down to a forward pass on the device, one detail kept catching my eye: the same object appears as an argument at nearly every level of the class hierarchy. That is not an accident. Every knob in vLLM lives in vllm/config.py, and all of it is assembled into a single container called VllmConfig, which bundles six sub-configs:
What interests me here is less the contents than the plumbing. VllmConfig is a constructor parameter of WorkerWrapperBase, and it crosses the process boundary through collective_rpc on its way into init_worker. Once it lands inside the GPU worker process, every class reads only the slice it is interested in: the scheduler pulls its batching limits from SchedulerConfig, the model runner checks ModelConfig and DeviceConfig, and the cache logic reads CacheConfig. Nobody threads six separate objects through the engine — one container flows through the whole tree.
When I look at this from a maintainer's perspective, the payoff is extensibility. Inference is a fast-moving field, and new features usually mean new flags. With this design, adding a feature requires only adding a new option to VllmConfig — and because the whole config is already passed everywhere, whichever class needs the new flag (say, the model runner) can read it directly. No constructor signatures change, so nothing ripples through the engine, worker, or model classes.
The trade-off is documented rather than hidden: unit testing individual components gets harder, because every component now expects a complete config object. vLLM softens this with a default initialization function that creates a config with all fields set to None, so an isolated component can be tested against just the few fields it actually cares about.
This threading also explains a failure mode that trips people up: one misconfigured option can surface as a crash in a distant process, far from where the value was set. A bad gpu_memory_utilization parsed back at the CLI, for instance, only becomes visible when the worker starts profiling GPU memory. When a config field travels through two or three processes before anyone validates it, the stack trace shows you the victim, not the culprit — which is exactly why reading the full process tree beats staring at a single trace. The VllmConfig object is the thread that connects them all.